
- Oliver Hume Land Index and Residential Outlook is Australia’s first and only quarterly, multi-market analysis of the land sector and draws on Oliver Hume’s decades of proprietary data.
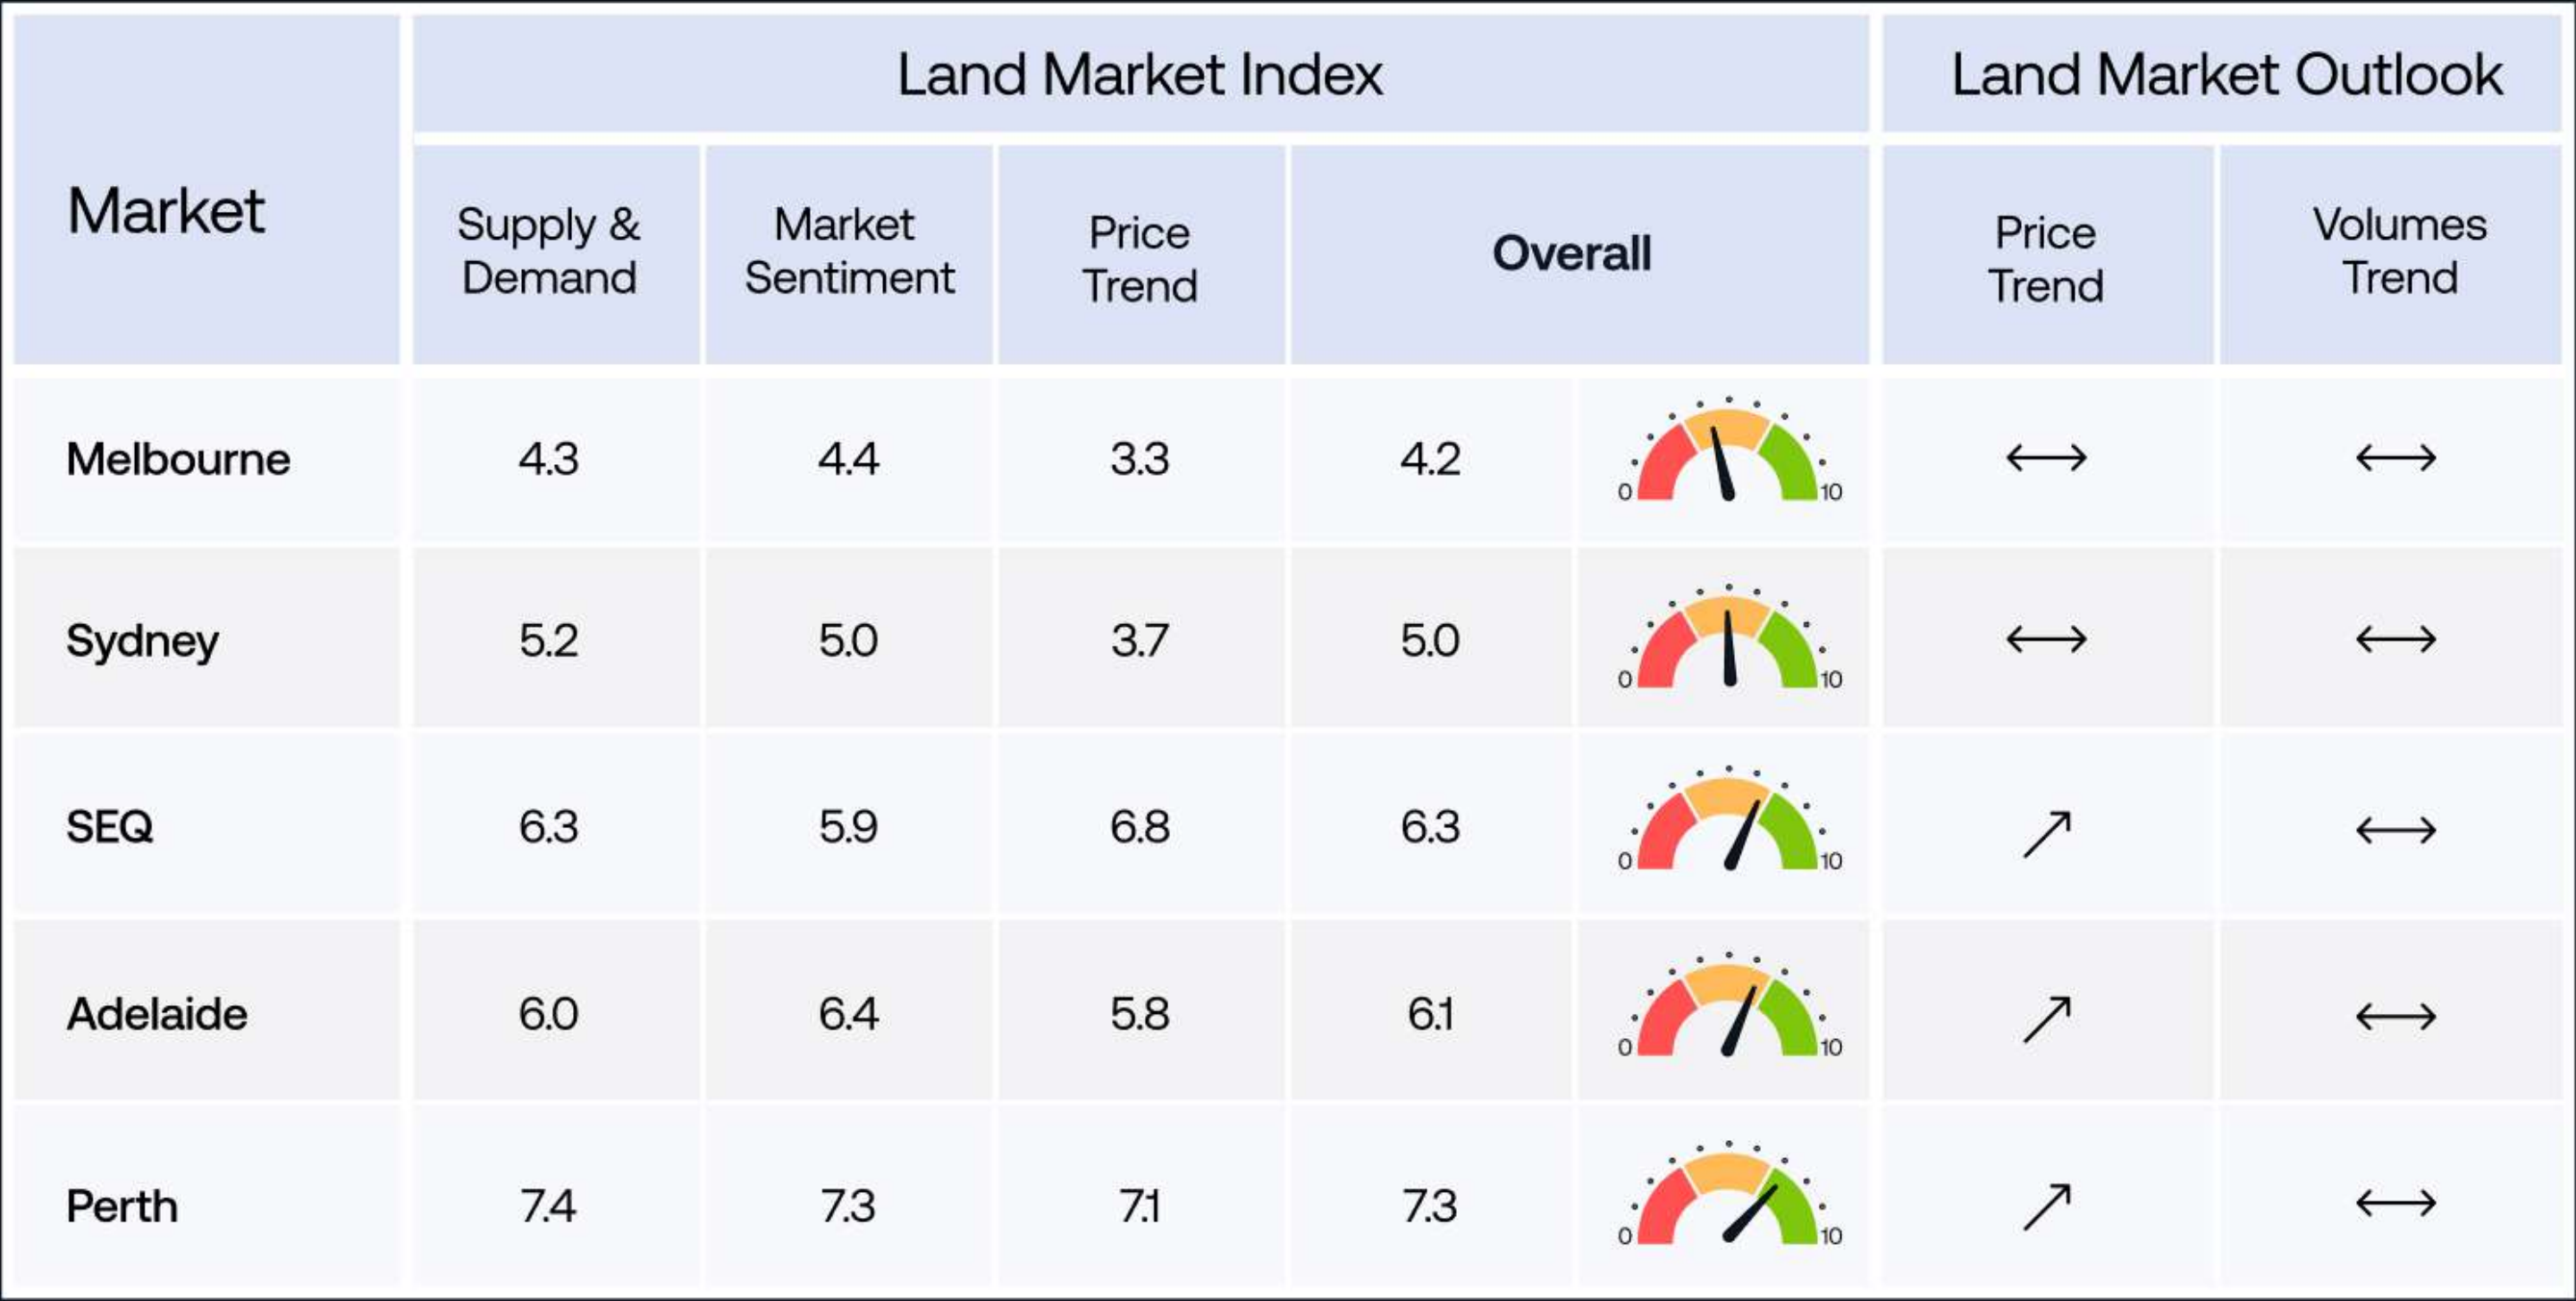
- Sydney’s overall Land Index score fell from 5.8 to 5.0 in the March quarter, moving the market from operating moderately above long-term average levels to operating right in line
- March price softening a response to rate increases.
Sydney’s greenfield land market slipped in the March 2027 quarter, with the Oliver Hume Land Index and Residential Outlook declining from 5.8 to 5.0, moving the market from operating moderately above long-term average levels to one operating now right in line.
The softening of prices in March was a response to two interest rate increases in the quarter, and the expectation of more, despite ongoing undersupply and underlying demand.
All of the decline in the Index score was due to a large drop in the Supply & Demand sub-index, as sales volumes fell by 20% compared to the December 2025 quarter levels.
The previous Index improvement in the December quarter activity had been a response to the rate cuts delivered earlier in 2025, which improved borrowing capacity and eased affordability pressures.
The Oliver Hume Land Index and Residential Outlook, is a comprehensive quarterly analysis of Australia’s major land markets and draws on decades of data and industry expertise to spotlight opportunities and risks in Australia’s $16 billion new land market.
The Index is produced by Oliver Hume’s team of research analysts, led by Chief Economist Matt Bell. It draws on the company’s unparalleled internal land sales data and third-party information to provide insights on key markets in Melbourne, Sydney, South East Queensland, Perth and Adelaide.
Worsening Interest Rate Environment
Oliver Hume Chief Economist Matt Bell said the worsening interest rate environment was likely to have an outsized impact on Sydney, the most interest-rate-sensitive market in the country.
“We expect steady levels of sales volumes, still constrained by supply issues, and prices now to remain flat as established market weakness impacts new house and land relative affordability compared to established housing,”
He said the weakness would also be felt in the market for established house price growth over 2026, before some recovery next year.
“We now expect established market house price growth to ease to in the 1%-3% range by the end of March 2027, with most weakness coming in the June and September quarters, with some recovery in early 2027,”
Oliver Hume Property Group CEO Julian Coppini said that, apart from the interest rate increases in the quarter, the other impact on the outlook for residential property overall and new land markets has been the 2026 Federal Budget.
“Outside the clearly positive impacts of increased infrastructure funding and planned regulatory streamlining, the change that has everyone talking are the changes to negative gearing and capital gains taxation for investors.
“The changing rates outlook and investor taxation environment clearly have affected the outlook for established market price growth.“
About The Index
The Oliver Hume Land Index and Residential Outlook is designed to provide greater understanding and transparency into Australia’s $16 billion a year land sales market. The quarterly Index has two core components.
State of Key National Land Markets
Provides a systematic assessment of the current condition of major land markets around the country. It allows users to compare relative performance across regions and identify the current phase of the cycle in each market.
Each market receives a score calibrated to 5 as the benchmark for a balanced market. A reading above 5 indicates conditions operating above the long-term average, while a reading below 5 signals a market performing below trend. This normalised approach enables direct comparison across cities and regions and allows the research team to systematically rank performance nationwide.
Residential Market Outlook
A 12-month outlook for the key market metrics of land sales volumes and price growth and an outlook for established market house price growth for each market.
ENDS
Media enquiries to:
Mitchy Koper
Oliver Hume
M.koper@oliverhume.com.au
0417 771 778
Lilly Mackay
Oliver Hume
l.mackay@oliverhume.com.au
Frequently Asked Questions


.jpg)

.avif)
Enquire today and get the edge in property


Privacy policy. Privacy Collection Statement. Disclaimers.
© Copyright 2025. Powered by TAG